Mano Stick Data Visualization for Success!ManoStick is the Advanced Charting Concept for profitable Stock Trading. Stock analysis made easy with ManoStick stock chart, as you can see the whole story within minutes. By looking what happend in previous sessions clearly, you can predict the the trend. As you know the first-generation charts were drawn only with closing price which is Line chart. The second-generation charts, such as Bar & CandleStick were drawn using Opening, High, Low and Closing price.Mano Stick adds another important dimension to the charts, which is popularity. In case of stock charts, that is volume. ManoStick brilliantly integrates the price data with the traded volume. That is why, using ManoStick the traders and investors can make the right decisions in a short amount of time eliminating all the thinkable and unthinkable errors and the inaccuracy, which occurred in the first and second-generation of the stock charts. 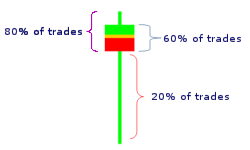 You can learn more by reading The ManoStick: An Ariel View of the Stock Market. ISBN: 978-0956395603. Here you can read more if you want to improve your trading skills thus giving better results again and again. 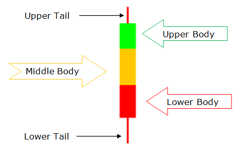 ManoStick has five microstructures, each representing 20% of the traded volume which are Upper Tail, Upper Body, Middle Body, Lower Body and Lower Tail. The tiny Hot-Spot on Mano Stick shows you on what price range the traders and investors were confident enough to exchange their shares. Mano Stick Stock Chart is a method to visualize market psycology. When you learn to analize Micro Structure and Hot-Spot on Mano Stick, you get the whole picture to forcast the future price and trend in early stage. Is the Hot Spot narrow or wide? Is the Hot Spot up or down between the high and low? Is the Hot Spot over your resistance or below the support? All the markets move according to the supply and demand. Mano Stick is the supply & demand tracker and you can navigate the market easily by using it. Philosophy of Mano Stick1. To be a tracker of Supply & Demand as all the markets move according to the S&D.2. To visualize price changes such a way that the user and analyst can predict trend changes in early stage 3. Resist errors & manipulative price changes, not like Bar & Candlestick charts which were always open to attacks. | The ManoStick : An Ariel View of the Stock Market ISBN: 978-0956395603  Buy at Amazon and read the book if you want to improve your trading skills thus giving better result again and again. Buy at Amazon and read the book if you want to improve your trading skills thus giving better result again and again.
Published papers;
| |